Satisfying user experience should be your top priority if you want your website to grow. If users are pleased with the content you provide on the site, they are more likely to revisit it, increasing engagement. A heatmap helps understand the user’s interest and improves your website’s performance. The blog will walk you through a detailed guide on the heatmap and its types to understand users’ actions and enhance your website’s performance.
Table of Contents
What Is Heatmap For Websites?
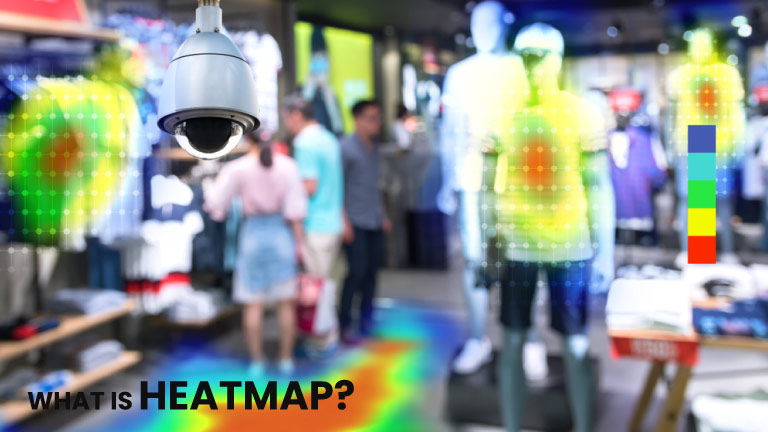
A heatmap is a graphic representation of data showing the user’s website behavior. It visually represents everything from where they have navigated to whether they have paused. Heatmap uses a system of color coding to demonstrate each value.
Since the website’s heatmap informs which part of the site receives the topmost clicks, you can use this information to improve the page design. This ensures that the paramount content is located in the most visible areas. So, if you are looking for ways to learn how your users interact with your websites, the heatmaps are a great place to start.
Heatmap metrics show the data in more than two colors, indicating each element’s value. These include red, green, yellow, and blue. Once the metric is revealed on the screen, the area of the pages will be color-coded according to its importance. The most clicked parts of sites will be the brightest, while the less-clicked elements will have faded colors.
What Are The Benefits Of Using Heatmap?
If you are a digital marketer, a product manager, or a UX designer, there are certain advantages to using heatmaps. We have listed a few benefits that can make the data more understandable and improve the website.
- Track User Behaviour: To improve the site’s design and functionality, heatmaps can help you identify which page or part of the website is highlighted with a dark color and which parts are not.
- Assess Demographics: Heatmaps also help you identify the best-performing locations, territories, and demographics to understand and capture new markets and improve the existing locations.
- Better Understanding of Patterns: Once you identify the user behavior of the target audience, heatmaps can help you increase user engagement and sales.
- Enhance Conversion Rates: To optimize sales and conversion, heatmaps allow you, as a professional, to identify the gaps preventing users from completing the purchase.
Different Types Of Heatmap Sites
Once you know what a heatmap is, it is natural to want to know more about it. However, to leverage its full potential, you must discover different types of heatmaps.
1. Click Heatmaps
Click heatmaps to record where users have clicked on the website. They show the integral part of the site where the clicks are at their maximum. You can also see the areas of the site that are less clicked to determine their value.
2. Mouse Movement heatmaps
As the name says, mouse heatmaps record mouse movement on the site. It is effectively helpful in understanding where the users hover, hesitate, and thrash their cursor. It is one of the informative heatmaps as it is believed that where the mouse cursor is placed, visitors are looking right there seeking information.
3. Scroll Heatmaps
Like how the click heatmaps represent the area of the site users have clicked, the scroll heatmap represents the site users have scrolled the most. It goes like how many visitors scrolled through a page to the bottom or how many scrolled to the bottom but stopped in between.
4. Conversion Heatmaps
Conversion heatmaps act when the user completes the desired action, such as purchasing, clicking on CTA, and signing up for a newsletter. Use this information to evaluate the visitors’ navigation and the reason for taking the desired result.
5. Eye Tracking Heatmaps
Eye-tracking is the most intruding heat map among the others. It tracks the eye movement of the users on a webpage and understands their interests. Sounds cool, isn’t it?
How To Read Heatmaps For Website?
The heatmap looks analogous to the temperature heatmap you see on TV. On the temperature heatmap, red typically represents the hotter weather and blue the coldest. Similarly, the website heatmap shows the brightest color representing a more considerable value and the darker color depicting a lower value.
Things To Learn From A Movement Heatmap:
- If users quickly engage with the pivotal parts of the content, like buttons, links, and text, they are placed right.
- If anything around the website’s hot area distracts the users, it’s better to relocate that element.
- Check if the forms make sense to visitors. If the website includes more than 2 fields, ask yourself if removing them will make sense.
Conclusion
Heatmap analytics give insight into user behavior that no analytics tools have provided. You will likely offer better service once you understand your audience’s interest through the website heatmap. Improving your website interface for users is one of the primary sources of website traffic that helps increase engagement and conversion rates.
Frequently Asked Questions
Q1. What Is A Heatmap Used For?
Product managers and digital marketers can use the heatmap as an analytical tool. It is most commonly used to identify user behavior and for websites, specifically for web pages and website templates.
Q2. How do I analyze a heatmap?
Since heatmaps are used to identify patterns, user behavior, and data patterns, there are a few ways to analyze a heatmap:
- Study the colors that will help you interpret the areas of highest measurement to lowest activity.
- Create a hypothesis to understand why the site or the page is underperforming.
- The visual representation will provide context and help developers identify areas for improvement in the site’s functionality and conversion rates.
Q3. What is the principle of heatmap?
The principle of heatmap is to visualize data patterns through color and axis. The warmer color represents the highest value, and the cooler colors represent the lower value. The axis determines the various categories of data.
Q4. What is heatmap scale?
A heatmap scale is the color gradient scale, allowing easy differentiation between low and high values. The data values are transformed into color scale.
